Ukraine Export Data is the right choice for businesses around the world to track country’s every export activity. It covers transaction-level information on consignments which depart from Ukraine through various modes of transport. Ukraine trade data is based on shipping bills, import bills, invoices and other documents required in importing & exporting goods from one country to another. We have Ukraine customs data available from 2013 to present.
Ukraine export data contains Date, Exporter Name, Exporter Address, Importer Name, Importer Address, HS Code, Product Description, Trading Country, Origin Country, Gross Weight KG, Net Weight KG and Invoice Value USD. Here is a sample which will help you understand exact format of Ukraine trade data.
| Date | 04-Nov-2019 | ||
|---|---|---|---|
| Exporter Name | ***** | Exporter Address | ***** |
| Importer Name | ***** | Importer Address | ***** |
| HS Code | 2203000900 | ||
| Product Description | Beer malt: Beer "Stella Artois Svetloe" in a tin can of 0,5l on 24 cans in packing - 1600 packs., - 38400 pieces | ||
| Trading Country | BY | Origin Country | UA |
| Gross Weight KG | 20430 | Net Weight KG | 19738 |
| Invoice Value USD | 11856 | ||

Find genuine exporters in Ukraine and connect to the right prospects.

Analyze business activities of Ukraine companies and their trading partners.

Identify your competitors and track their business activities.

Evaluate market condition of Ukraine with special focus on supply chain.

Study market trends and discover new business opportunities.

Conduct a good research on product, industry or on a particular HS Code.
As per Ukraine export data, Ukraine’s exports totalled USD 49.3 billion in 2020, a marginal decline from 2019’s USD 49.8 billion. Ukraine customs data shows Ukraine was 51st world’s largest exporter country in 2020.
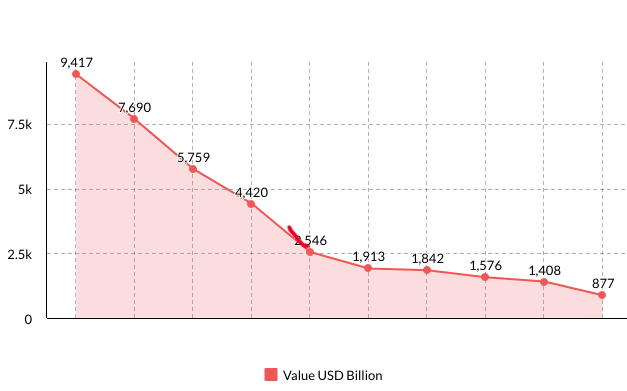
As per Ukraine export data, Ukraine’s top 10 exports in 2020 were Cereals (19.0%), Iron & Steel (15.5%), Animal or Vegetable Fats & Oils (11.6%), Ores, Slag & Ash (8.9%), Electrical Machinery & Equipment (5.1%), Machinery (3.8%), Oil Seeds & Oleaginous Fruits (3.7%), Residues & Waste from Food Industry (3.1%), Wood and Articles (2.8%) and Articles of Iron & Steel (1.7%). Ukraine export statistics show Ukraine’s top 10 export categories accounted for 75.2% to overall value of shipments which depart from the country via all modes of transport in 2020.
| Product | Value USD Million |
|---|---|
| Cereals | 9,417 |
| Iron & Steel | 7,690 |
| Animal or Vegetable Fats & Oils | 5,759 |
| Ores, Slag & Ash | 4,420 |
| Electrical Machinery & Equipment | 2,546 |
| Machinery | 1,913 |
| Oil Seeds & Oleaginous Fruits | 1,842 |
| Residues & Waste from Food Industry | 1,576 |
| Wood and Articles | 1,408 |
| Articles of Iron & Steel | 877 |

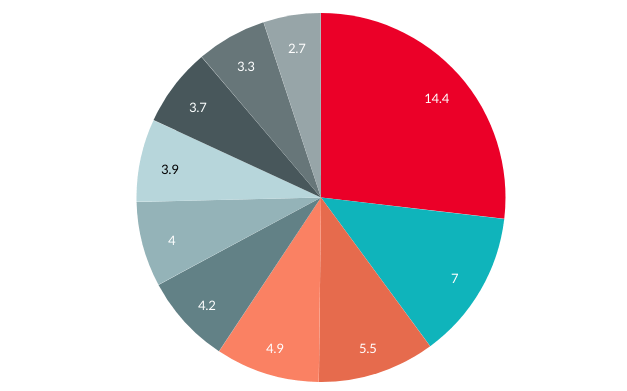
As per Ukraine export data, Ukraine’s top 10 export partners in 2020 were China (USD 7,107 million), Poland (3,442 million), Russia (USD 2,706 million), Turkey (USD 2,416 million), Germany (USD 2,097 million), India (USD 1,971 million), Italy (USD 1,930 million), Netherlands (USD 1,813 million), Egypt (USD 1,618 million) and Belarus (USD 1,339 million). Ukraine trade statistics show Ukraine’s top 10 export partners accounted for 53.6% to overall value of export consignments recorded in 2020.
| Country | Value USD % |
|---|---|
| China | 14.4 |
| Poland | 7 |
| Russia | 5.5 |
| Turkey | 4.9 |
| Germany | 4.2 |
| India | 4 |
| Italy | 3.9 |
| Netherlands | 3.7 |
| Egypt | 3.3 |
| Belarus | 2.7 |
