Uzbekistan Export Data is a type of Customs Data, which gives full visibility into country’s export activities. It is based on shipping bills, import bills, invoices and other import-export documents. Uzbekistan trade data is useful in finding right prospects, having competitive analysis and analyzing all market aspects. Uzbekistan export data is available from 2016 to present.
Fields available in Uzbekistan export data are Date, HS Code, Exporter Name, Importer Name, Destination Country, Sales Country, Product Description, Quantity, Unit, Net Weight, Cargo Value USD and Customs Value USD. Have a look at a sample to view columns with information of a single shipping record.
| Date | 01 April 2020 | HS Code | 0602201000 |
|---|---|---|---|
| Exporter Name | ***** | Importer Name | ***** |
| Destination Country | Kyrgyzstan | Sales Country | Kyrgyzstan |
| Product Description | Grape seedlings – weight 3000 kg. count 5000 pcs and 100 in bundles | ||
| Quantity | 5000 | Unit | PC |
| Net Weight | 3000 | Cargo Value USD | 8500 |
| Customs Value USD | 8500 | ||

Find real suppliers in Uzbekistan and connect with companies.

Evaluate business strategies of your competitors.

Track shipment activities of companies and their trading partners.

Define your business success from right market intelligence.

Analyze data by product, industry and HS Code and know market trends.

Do specific research on company, commodity and all market aspects.
As per Uzbekistan export data, Uzbekistan was 81st largest exporter country in the world during 2019. According to the latest Uzbekistan trade data available, Uzbekistan’s exports amounted USD 14.3 billion in 2019.
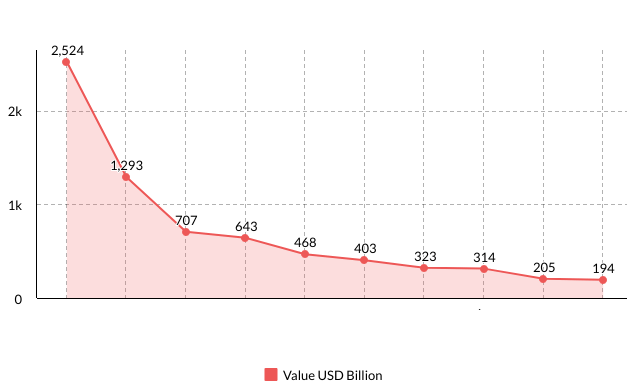
Uzbekistan customs data shows, Uzbekistan’s top 10 exports in 2019 were Mineral Fuels & Oils (17.6%), Cotton (9.02%), Copper & Articles (4.94%), Edible Fruits & Nuts (4.49%), Edible Vegetables & Certain Roots (3.26%), Plastics (2.81%), Knitted or Crocheted Apparel & Clothing (2.25%), Iron & Steel (2.19%), Zinc & Articles (1.43%) and Electrical Machinery & Equipment (1.36%). According to Uzbekistan export statistics, Uzbekistan’s top 10 export commodities accounted 49.35% to overall value of shipment departed from the country in 2019.
| Product | Value USD Million |
|---|---|
| Mineral Fuels & Oils | 2,524 |
| Cotton | 1,293 |
| Copper & Articles | 707 |
| Edible Fruits & Nuts | 643 |
| Edible Vegetables & Certain Roots | 468 |
| Plastics | 403 |
| Knitted or Crocheted Apparel & Clothing | 323 |
| Iron & Steel | 314 |
| Zinc & Articles | 205 |
| Electrical Machinery & Equipment | 194 |

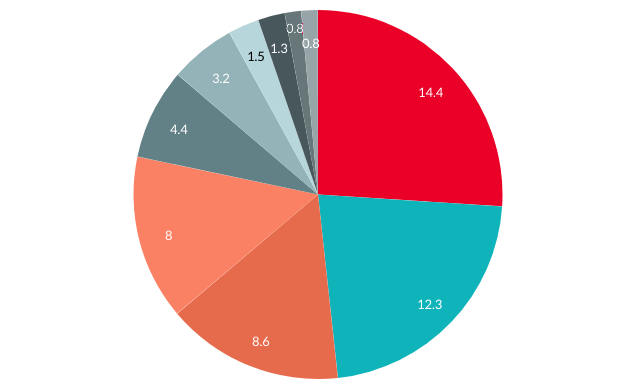
As per Uzbekistan shipment data, Uzbekistan’s top 10 export partners in 2019 were Russia (USD 2,067 million), China (USD 1,767 million), Kazakhstan (USD 1,237 million), Turkey (USD 1,149 million) and Kyrgyzstan (USD 635 million). According to Uzbekistan customs data, Uzbekistan’s top 10 export partners accounted 47.7% to overall value of shipments.
| Country | Value USD % |
|---|---|
| Russia | 14.4 |
| China | 12.3 |
| Kazakhstan | 8.6 |
| Turkey | 8 |
| Kyrgyzstan | 4.4 |
| Afghanistan | 3.2 |
| Iran | 1.5 |
| Tajikistan | 1.3 |
| United Arab Emirates | 0.8 |
| Ukraine | 0.8 |
