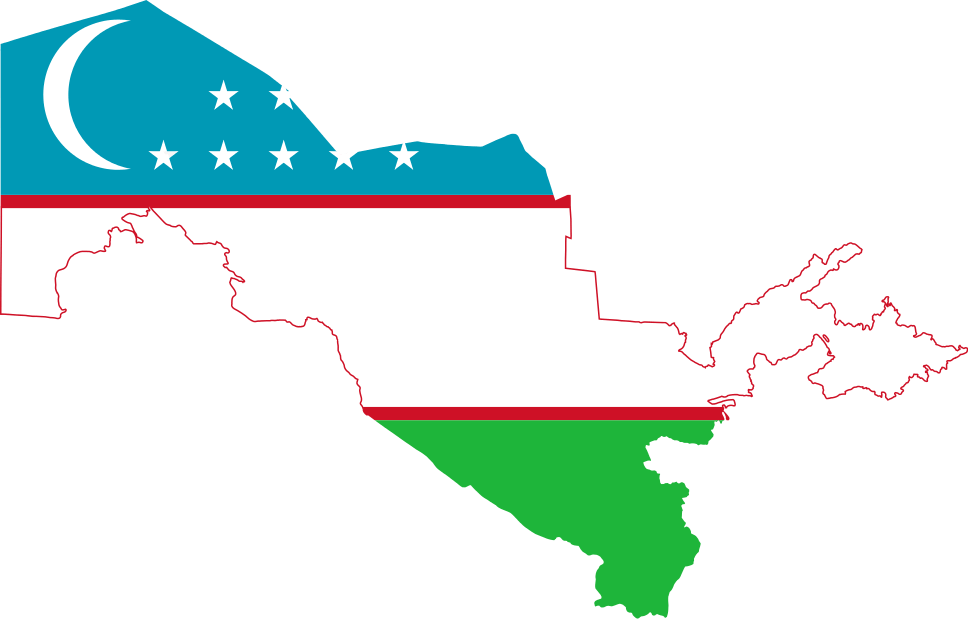
Uzbekistan Import Data contains transaction-level information on containers which enter into the country through all modes of transport. It is based on shipping bills, import bills, invoices and other import export documents. We collect Uzbekistan trade data of Custom Departments, Shipping & Logistics Companies, Port Authorities, Trade Associations and Government Bodies. We have Uzbekistan shipment data available from 2016 onwards.
Date fields available in Uzbekistan import data includes Date, Importer Name, Exporter Name, Departure Country, Sales Country, HS Code, Product Description, Quantity, Unit, Net Weight, Customs Value USD and Origin Place. Here is a sample of Uzbekistan imports and view information of a single shipment record.
| Date | 05-Apr-2020 | ||
|---|---|---|---|
| Importer Name | ****** | Exporter Name | ****** |
| Departure Country | Turkey | Sales Country | Japan |
| HS Code | 2804690000 | ||
| Product Description | Silicon:- Other 1) Reactive silicon kit 5500SC - 1 piece - weight: 8 kg; 2) 1 cardboard box,; 8) 102; | ||
| Quantity | 8 | Unit | KG |
| Net Weight | 8 | Customs Value USD | 455.6 |
| Origin Place | Namangan | ||

Find genuine importers in Uzbekistan & get connected for business engagement.

Know who are trading partners of Uzbekistan’s importers.

Evaluate business of your competitors.

Understand product demand in market of Uzbekistan.

Discover new industries for business expansion.

Analyze data by foreign country, value, weight, etc.
Uzbekistan stood at 72nd position in 2019. As per Uzbekistan customs data, Uzbekistan imported goods valued USD 21.8 billion in 2019, which rose from 2018’s USD 17.3 billion. Uzbekistan trade statistics show Uzbekistan’s top 10 imports in 2019 were imported Machinery (25.6%), Vehicles (9.7%), Iron & Steel (6.5%), Electrical Machinery & Equipment (6.1%), Mineral Fuels & Oils (4.2%), Pharma Products (4.2%), Plastics (3.7%), Articles of Iron & Steel (3.5%), Wood & Articles (2.8%) and Optical, Photographic, Medical Equipment (2.6%). Based on record-by-record shipments and Uzbekistan customs data, Uzbekistan’s top 10 imports accounted 68.9% to overall value of shipments in 2019.
| Product | Value USD Million |
|---|---|
| Machinery | 5,611 |
| Vehicles | 2,136 |
| Iron & Steel | 1,428 |
| Electrical Machinery & Equipment | 1,335 |
| Mineral Fuels & Oils | 928 |
| Pharma Products | 926 |
| Plastics | 811 |
| Articles of Iron & Steel | 785 |
| Wood & Articles | 611 |
| Optical, Photographic, Medical Equipment | 583 |

Uzbekistan’s top 5 import partners in 2019 were China (USD 5 billion), Russia (USD 3.9 billion), South Korea (USD 2.5 billion), Kazakhstan (USD 1.8 billion) and Turkey (USD 1.2 billion).
Our Uzbekistan shipment data shows that top 5 import partners of Uzbekistan accounted 67.4% to overall value of shipments which enter into the country in 2019. Check percentage share of these countries from the chart given here.
| Country | Value USD % |
|---|---|
| China | 23.1 |
| Russia | 18.2 |
| South Korea | 11.6 |
| Kazakhstan | 8.6 |
| Turkey | 5.9 |
| Germany | 4 |
| United States | 2.3 |
| Lithuania | 2 |
| Turkmenistan | 1.8 |
| Japan | 1.7 |
